218-草图到准发表级绘图要多久?
刘小泽写于2020.12.02 最近是越发感觉到,待发表的图真是难调,比作图麻烦多了
从草图到准发表级
先来看如何做草图
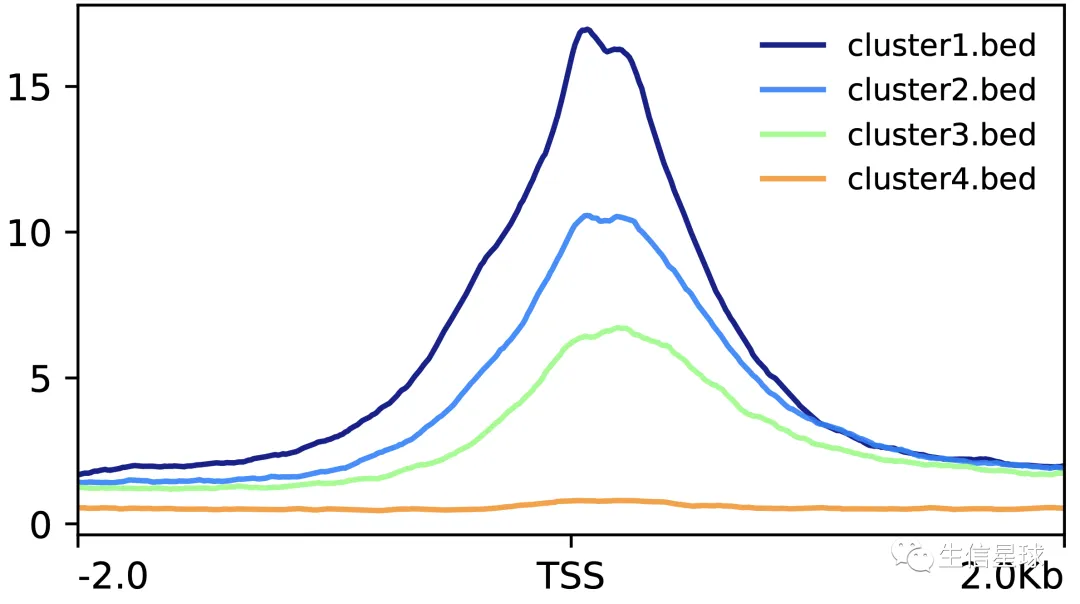
我最近根据ChIP-Seq的bw文件,利用deeptools绘制了一些TSS附近的信号分布
代码很简单其实
# 先根据reference-point计算基因组区域上的reads分布
computeMatrix reference-point --referencePoint TSS -b 2000 -a 2000 -R cluster1.bed cluster2.bed cluster3.bed cluster4.bed # 这里我自定义了4个cluster\
       -S S0_RPKM.bw\
       --skipZeros \
        -p 4 \
       --missingDataAsZero \
       -o suz12_rpkm_TSS.2k.gz \
       --blackListFileName mm10.merge.blacklist.bed \
       --outFileSortedRegions suz12_rpkm_TSS.2k.bed
具体原理是:将指定区域(比如TSS上下2kb)划分为等长的区间即bin, 然后计算每个bin内所有位点的测序深度,默认用所有位点测序深度的平均值来代表这个区间
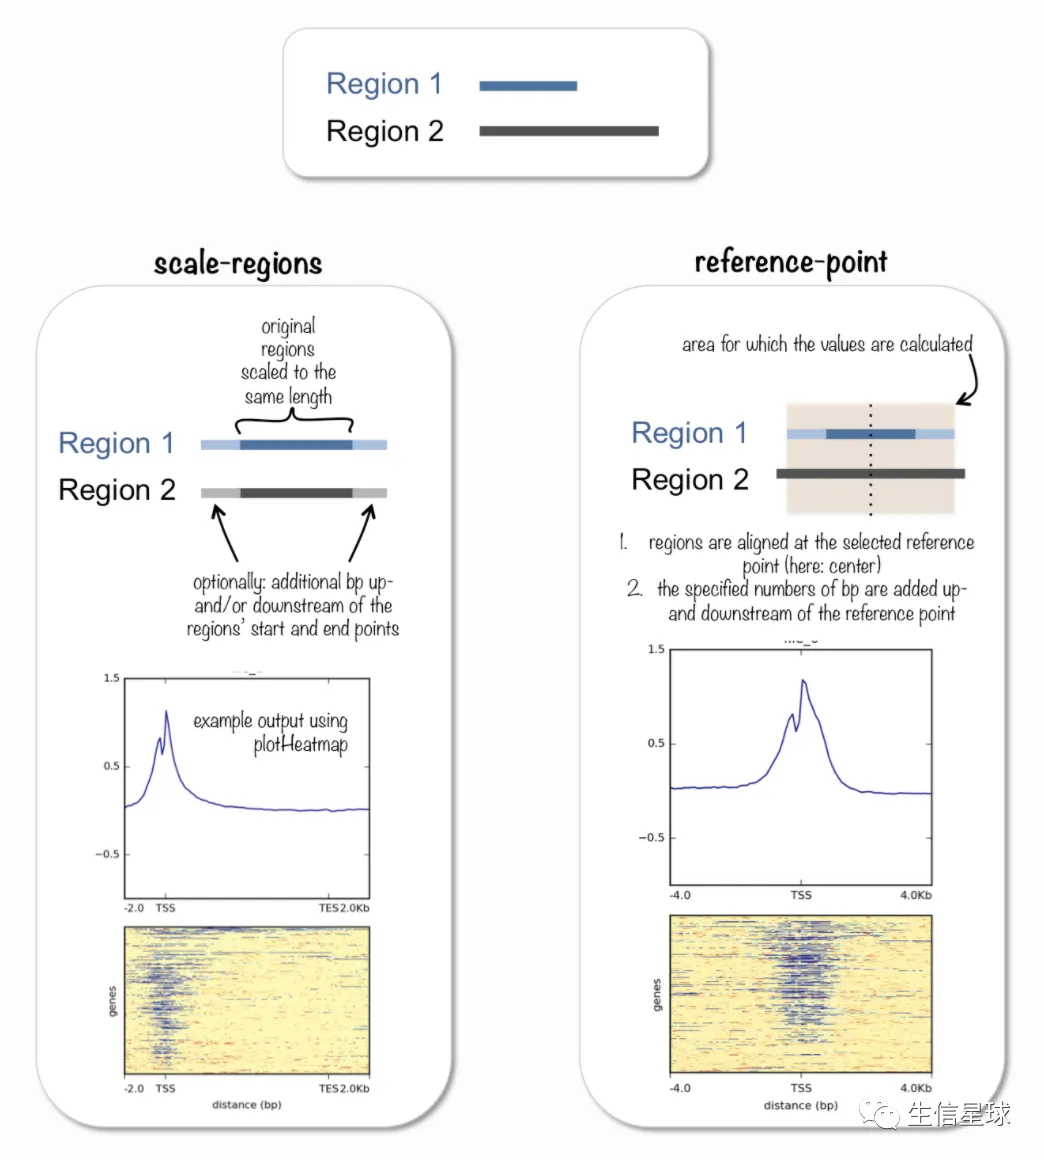
当然有两种模式可供选择:
https://deeptools.readthedocs.io/en/develop/content/tools/computeMatrix.html
- for computing the signal distribution relative to a point (
reference-point), e.g., the beginning or end of each genomic region - for computing the signal over a set of regions (
scale-regions) where all regions are scaled to the same size
之后可以进行作图
plotProfile -m suz12_rpkm_TSS.2k.gz \
	-out suz12_Profile.pdf
草图中的一些问题
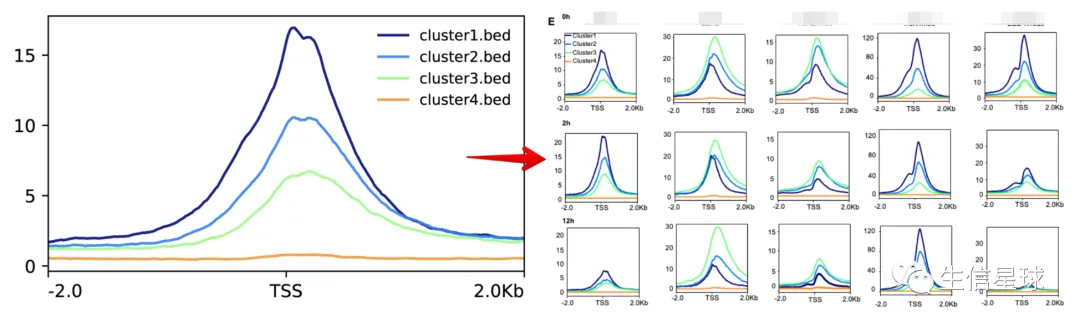
问题一:每个图的纵坐标不一致,怎么办
如果一个文件一个文件去操作,纵坐标会根据每个文件信号值不同而自适应调整,因此对于同一个处理的多个时间点数据,不太方便直接比较
解决方法是:将同一个处理的多个文件一次性计算导出
# 比如这里suz12有三个时间点的数据
computeMatrix reference-point --referencePoint TSS -b 2000 -a 2000 -R cluster1.bed cluster2.bed cluster3.bed cluster4.bed \
       -S S0_RPKM.bw S2_RPKM.bw S12_RPKM.bw \
       --skipZeros \
        -p 4 \
       --missingDataAsZero \
       -o suz12_all_rpkm_TSS.2k.gz \
       --blackListFileName mm10.merge.blacklist.bed \
       --outFileSortedRegions suz12_all_rpkm_TSS.2k.bed

plotProfile -m suz12_all_rpkm_TSS.2k.gz -out suz12_all_Profile.pdf --plotHeight 6.93 --numPlotsPerRow 1 --samplesLabel " " " " " " -T " "  -y " "
# --numPlotsPerRow 表示每行只保留一个图,目的是方便对比不同时间的变化
# --plotHeight 的设置基本是:H(每个图想要的高度)x N(总图片数量)
# 这几个空白“ ”表示不画label,省的到时候还得手动删除
# --plotTitle, -T: Title of the plot
# --samplesLabel: The default is to use the file name of the sample
这样得到的几个时间点的结果图,纵坐标就会保持一致
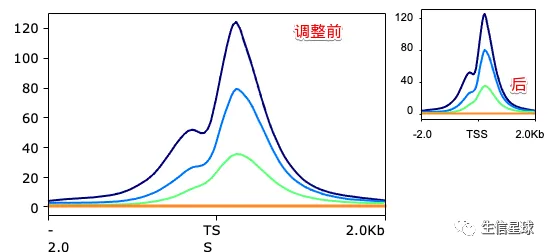
问题二:代码得到的图太大,怎么调整?
我们知道,一般发表级的图片都是密度比较大,能方正尽量方正,排列也会比较清楚
目前感觉比较方便的办法是:代码生成的图片保存为pdf格式,然后再将pdf转为ppt
有几个比较好的在线工具可以做(我测试了很多个,它们几个基本可以很完整并且很清晰导出PPT)
- https://pdf.wps.com/how-to-convert-pdf-to-presentation/
- https://www.freepdfconvert.com/pdf-to-ppt
- https://www.adobe.com/acrobat/online/pdf-to-ppt.html
之后在PPT中,先删除所有的文本框,然后将图片组合,随之调整大小。然后手动加上文本框(并且注意纵坐标一般保持4-5个点即可。如果纵坐标太密集,可以适当删掉几个点)
最后
经过我测试,一般一个草图编辑成准发表级,需要5分钟左右