235-一个非常良心的TCGA workshop推荐
刘小泽写于2021.2.25 今天翻看
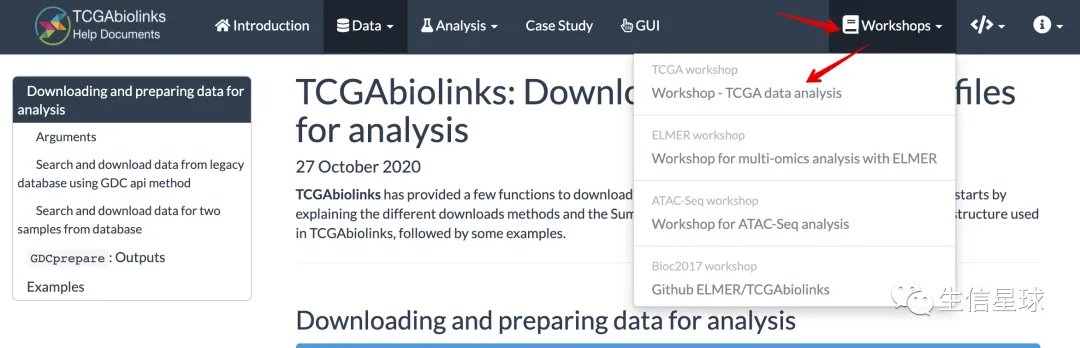
TCGAbiolinks的 说明书,看到几个相关的workshop,感觉很不错,推荐给大家
0 前言
直达workshop【更新于2019-08-30】:https://rpubs.com/tiagochst/TCGAworkshop
这个workshop的目的是:
- 学会从Genomic Data Commons (GDC)下载TCGA数据
- 如何将数据导入并分析
1 认识GDC
TCGA的数据主要存放在两个不同的数据库:
The legacy(译为:”遗留“) archive:https://portal.gdc.cancer.gov/legacy-archive/search/f,主要存放早期的一些数据。官方的介绍是:legacy data is not actively maintained, processed, or harmonized by the GDC
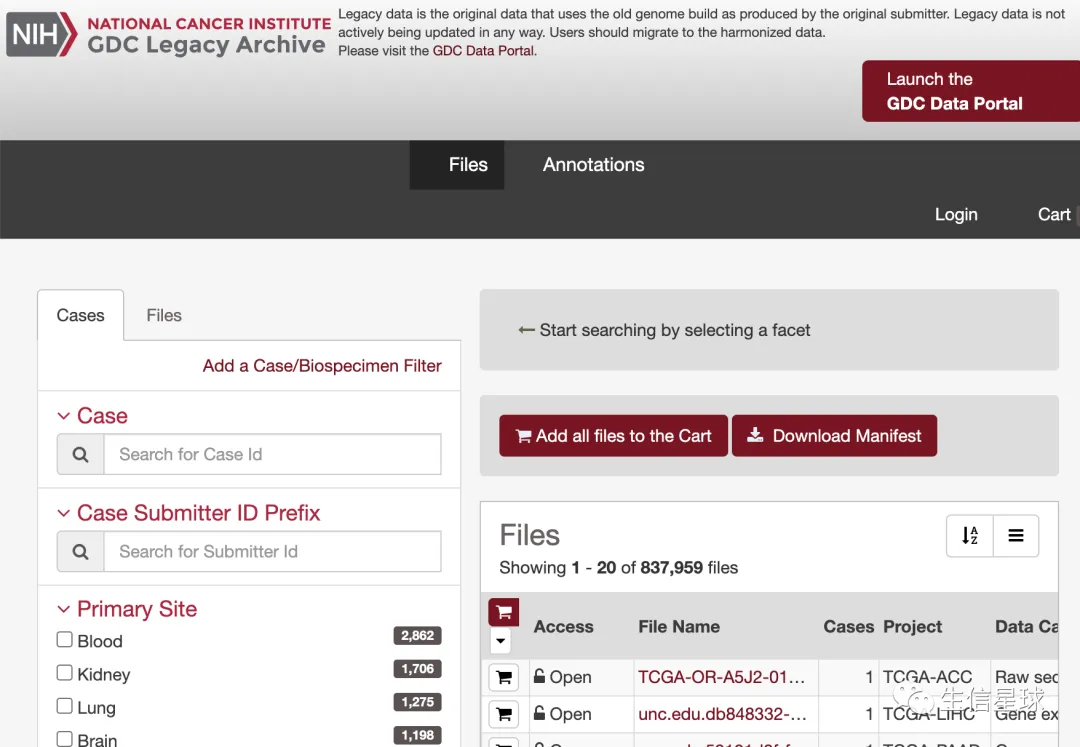
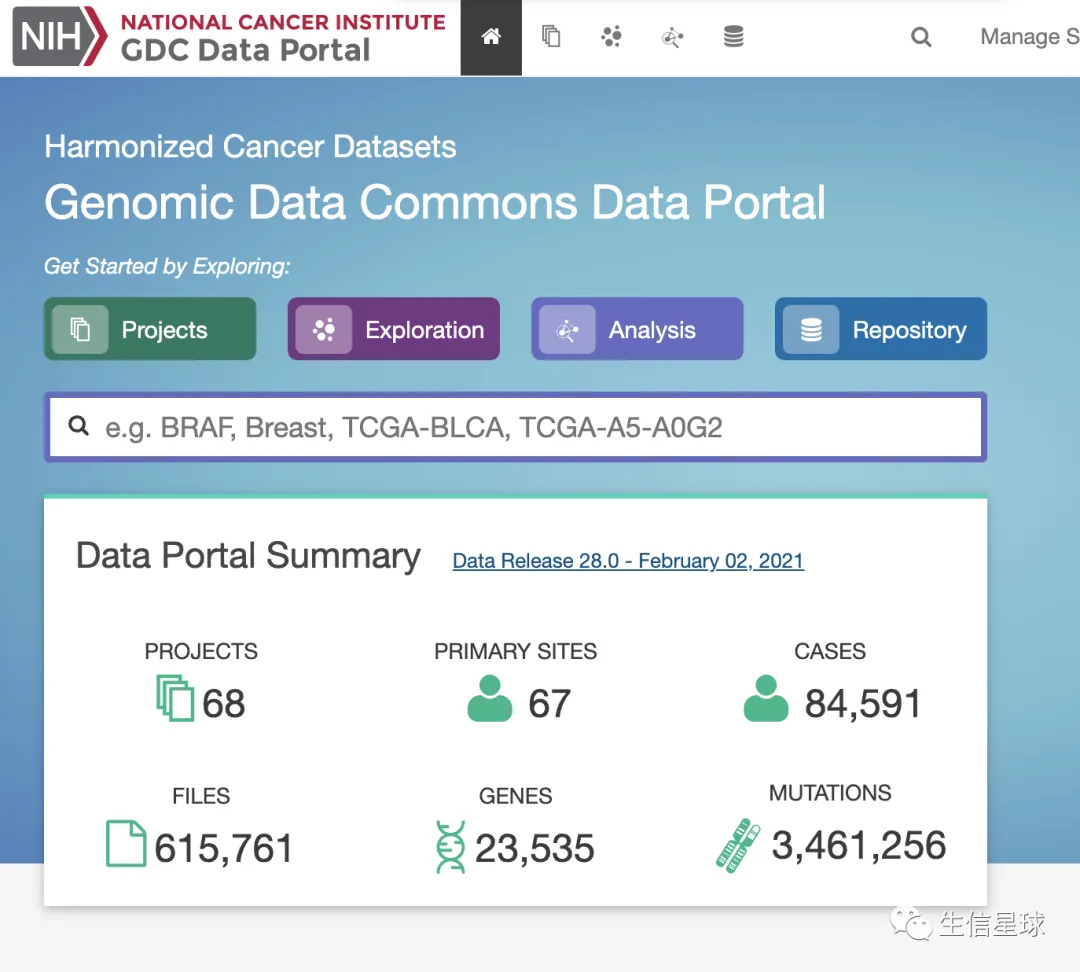
Harmonized database : https://portal.gdc.cancer.gov/,也就是大家最常见的网站。它是使用了统一的流程,并使用了hg38进行处理得到的结果,数据比较新
有一篇文章也介绍了二者的不同:
- Gao, Galen F., et al. “Before and After: Comparison of Legacy and Harmonized TCGA Genomic Data Commons’ Data.” Cell systems 9.1 (2019): 24-34. (https://doi.org/10.1016/j.cels.2019.06.006)
- 主要结论就是:
- TCGA早期的大部分样本是比对到hg19(还有少部分比对到hg18),叫做legacy omics data
- 后来各种软件流程逐渐成熟,GDC重新进行了一次操作,比对到了hg38,叫做harmonized omics data
- hg19和hg38版本得到的数据差别不大:The GRCh37 (hg19) and GRCh38 (hg38) TCGA data versions are highly concordant
2 认识TCGA
2.1 数据的两种权限
- Open: includes high level genomic data that is not individually identifiable, as well as most clinical and all biospecimen data elements.
- Controlled: includes individually identifiable data such as low-level genomic sequencing data, germline variants, SNP6 genotype data, and certain clinical data elements
2.2 TCGA样本命名
- 每个样本都有一个独特的名字,叫做:barcode
- 图片来自:https://docs.gdc.cancer.gov/Encyclopedia/pages/TCGA_Barcode/
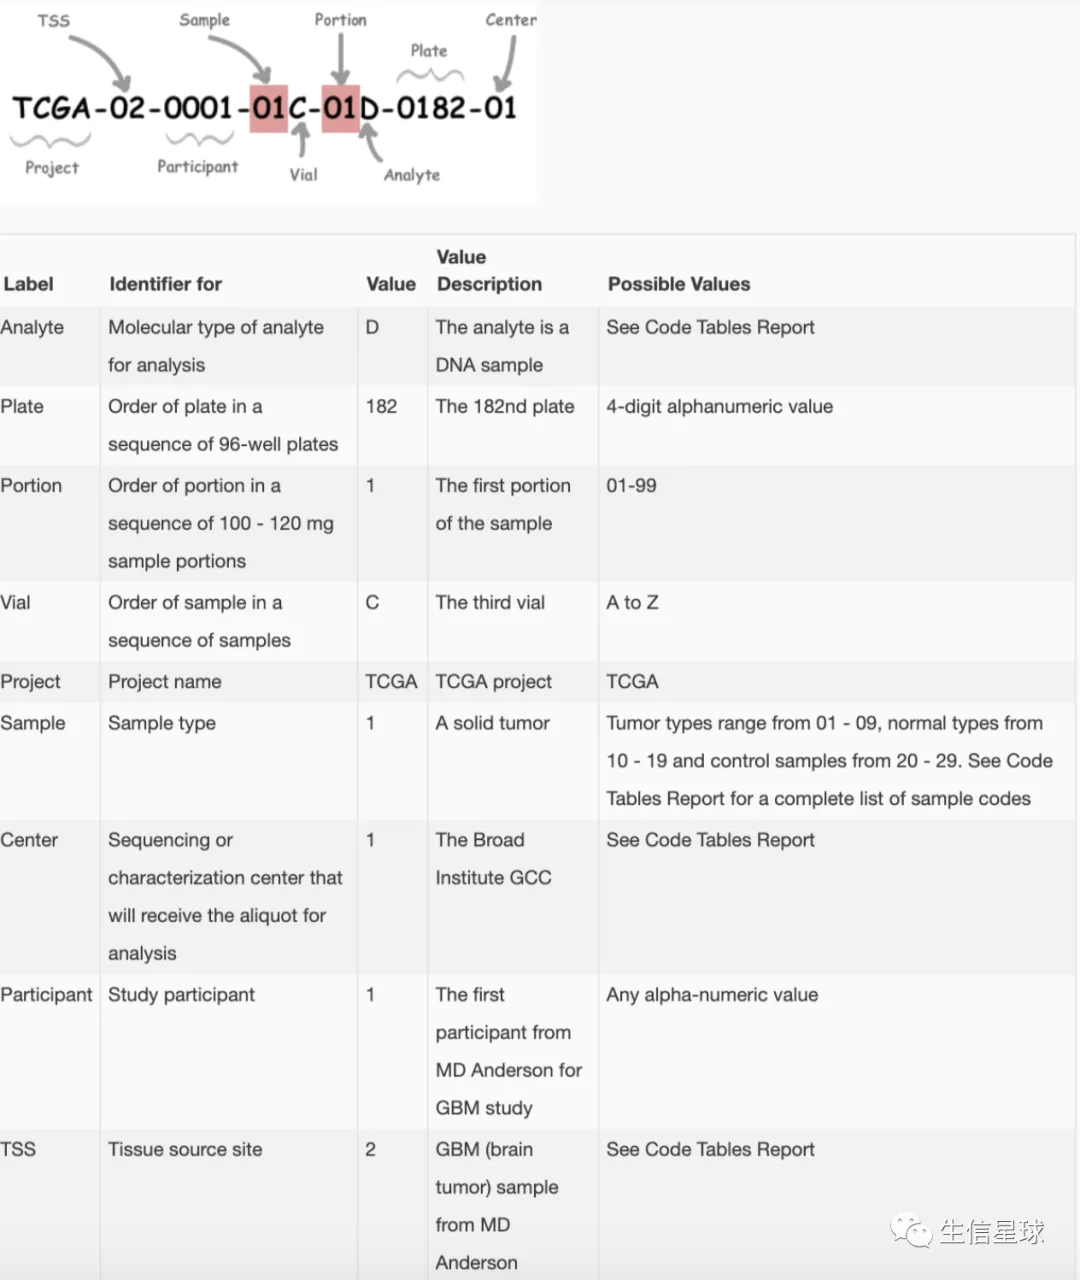
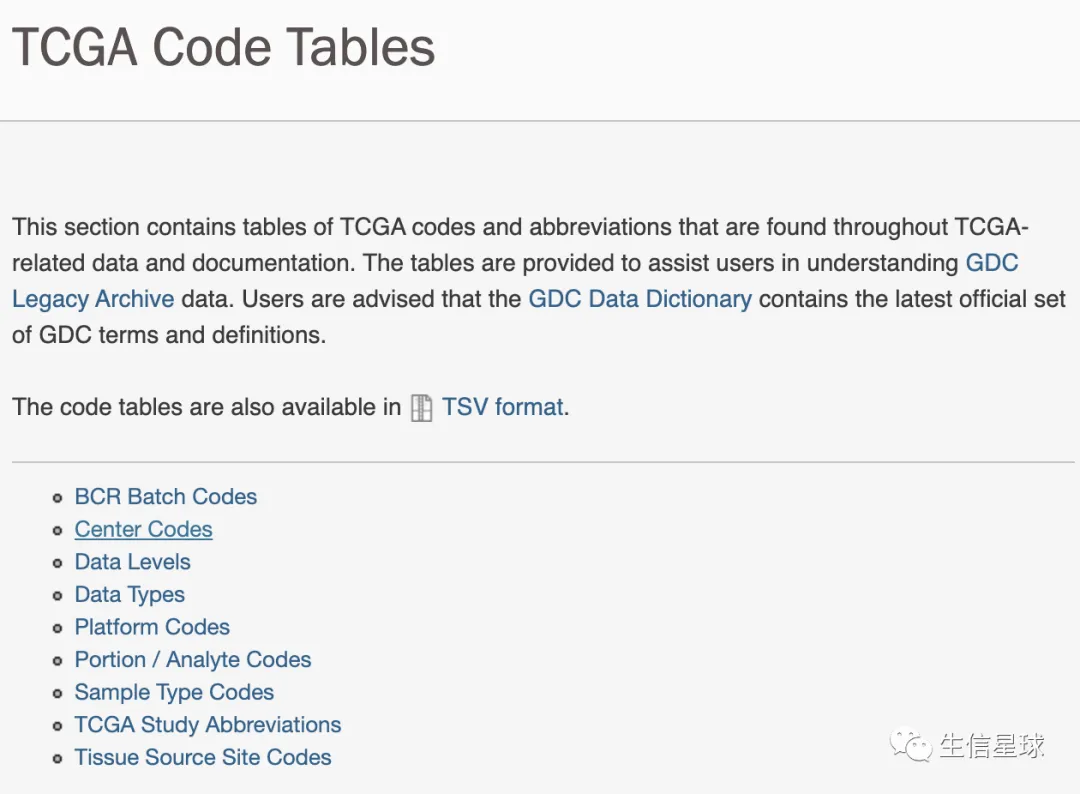
当然,每一部分还有更为详细的说明:https://gdc.cancer.gov/resources-tcga-users/tcga-code-tables
3 GDC主要的数据类型
在这里可以看到 https://portal.gdc.cancer.gov/repository
- Project:比如不同的大型项目,如TCGA、TARGET
- Data category:比如Transcriptome Profiling, DNA methylation, Clinical
- Data type:比如Gene Expression Quantification, Isoform Expression Quantification, Methylation Beta Value
- Experimental strategy:比如miRNA-Seq, RNA-Seq
- Workflow Type
- Platform
- Access type
总而言之,它们的层级关系是:
A project => has data on several categories => each category contains several data types => each type might have been produced with different workflows, experimental strategy and platforms
4 一个比较重要的R数据结构
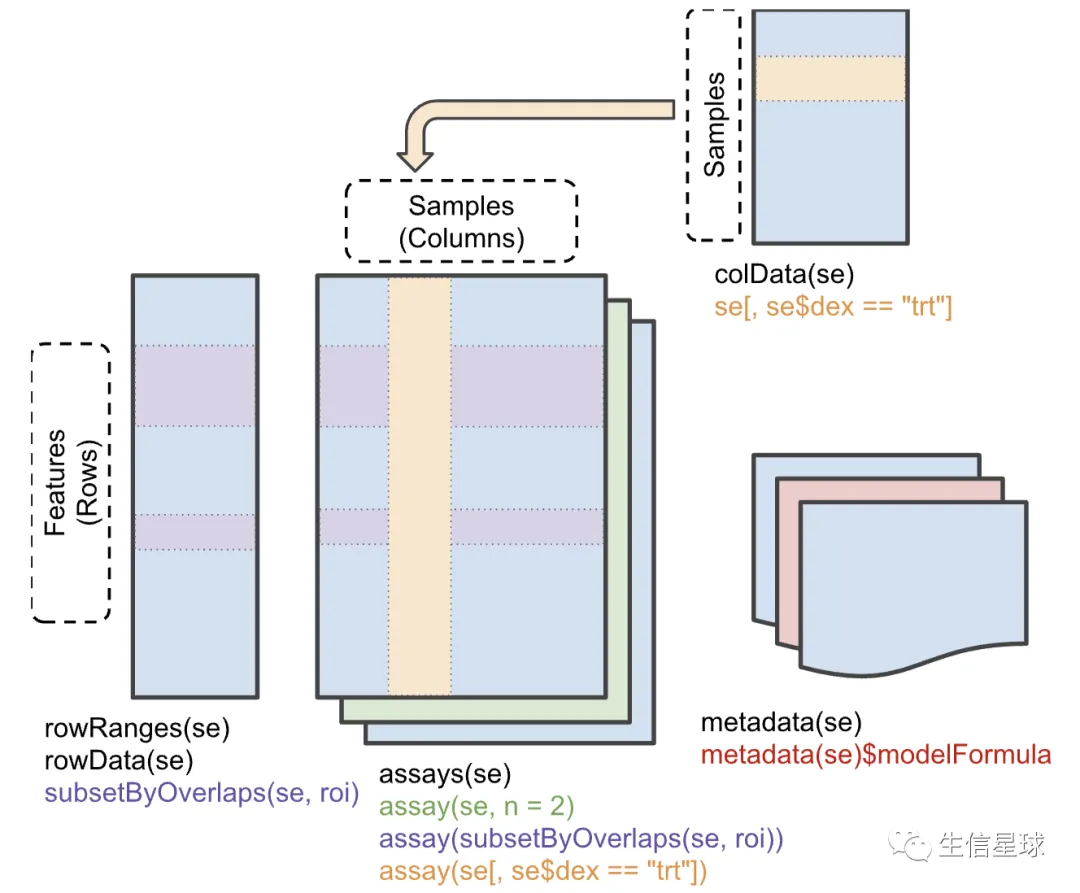
SummarizedExperiment 是非常常用的,它的示意图是(来自http://bioconductor.org/packages/SummarizedExperiment/):
You can access samples metadata with
colDatafunction, genomics data withassaysand genomics metadata withrowRanges.
5 实战
将从Harmonized GDC database (hg38 version)下载数据
主要包括以下几个方面:
- Access TCGA clinical data
- Search, download and make an R object from TCGA data
- RNA-seq data
- DNA methylation
- Download samples metadata
- Download and visualize mutations
- Download and visualize copy number alterations
5.0 加载包
if (!requireNamespace("BiocManager", quietly = TRUE))
    install.packages("BiocManager")

if (!requireNamespace("ComplexHeatmap", quietly = TRUE))
  BiocManager::install("ComplexHeatmap") # from bioconductor

if (!requireNamespace("TCGAbiolinks", quietly = TRUE))
  BiocManager::install("BioinformaticsFMRP/TCGAbiolinks") # from github

library(TCGAbiolinks)
library(MultiAssayExperiment)
library(maftools)
library(dplyr)
library(ComplexHeatmap)
5.1 临床信息
GDC的临床信息有这几个来源:
- XML files: original source of the data。包含更多的信息,比如radiation, drugs information, follow-ups, biospecimen, etc。下面的index数据就是XML的一个子集而已
- indexed clinical: a refined clinical data that is created using the XML files. 它包含的信息是不断更新的,比如一个病人活着的时候被收集了临床信息,但是后来继续调查时不幸因病去世,这时index数据就会显示死亡;而XML中就会比较冗余(首先是记录之前还活着,然后又记录了后来死亡)
- BCR Biotab: tsv files parsed from XML files
示例来自:https://portal.gdc.cancer.gov/cases/127f738d-afa1-42f6-a9a0-f33806667b84
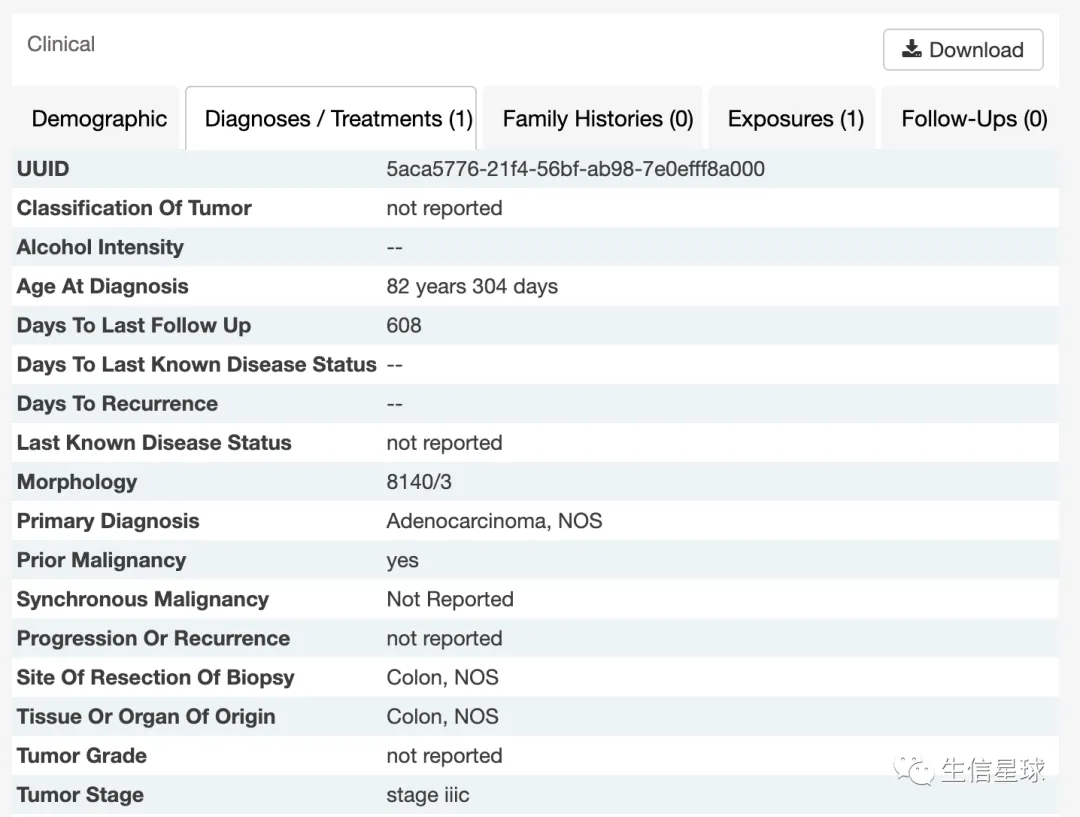
使用GDCquery_clinic获取
clinical <- GDCquery_clinic("TCGA-COAD")
head(clinical)
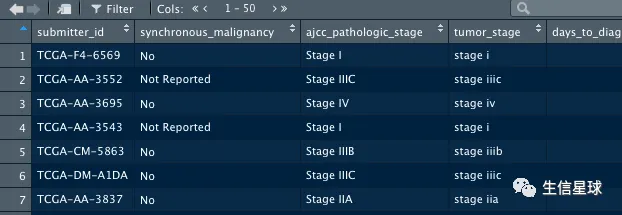
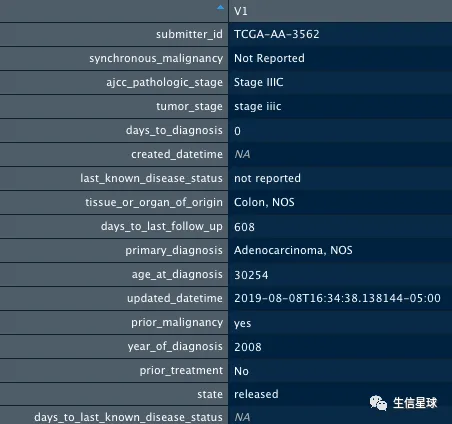
就以前面看到的病人TCGA-AA-3562为例:
clinical %>%
  dplyr::filter(submitter_id == "TCGA-AA-3562") %>%
  t %>%
  as.data.frame
获取Biotab信息
除了上面的index信息,还可以获取基于XML的Biotab文件(tab分隔),不过需要TCGAbiolinks版本高于2.13.5
query <- GDCquery(project = "TCGA-ACC",
data.category = "Clinical",
data.type = "Clinical Supplement",
data.format = "BCR Biotab")
GDCdownload(query)
clinical.BCRtab.all <- GDCprepare(query)
> names(clinical.BCRtab.all)
[1] "clinical_radiation_acc"
[2] "clinical_omf_v4.0_acc"
[3] "clinical_patient_acc"
[4] "clinical_follow_up_v4.0_acc"
[5] "clinical_follow_up_v4.0_nte_acc"
[6] "clinical_nte_acc"
[7] "clinical_drug_acc"
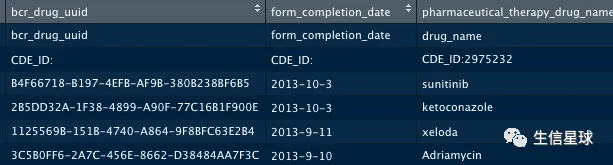
# 提取其中药物治疗信息
clinical.BCRtab.all$clinical_drug_acc %>%
head %>%
as.data.frame
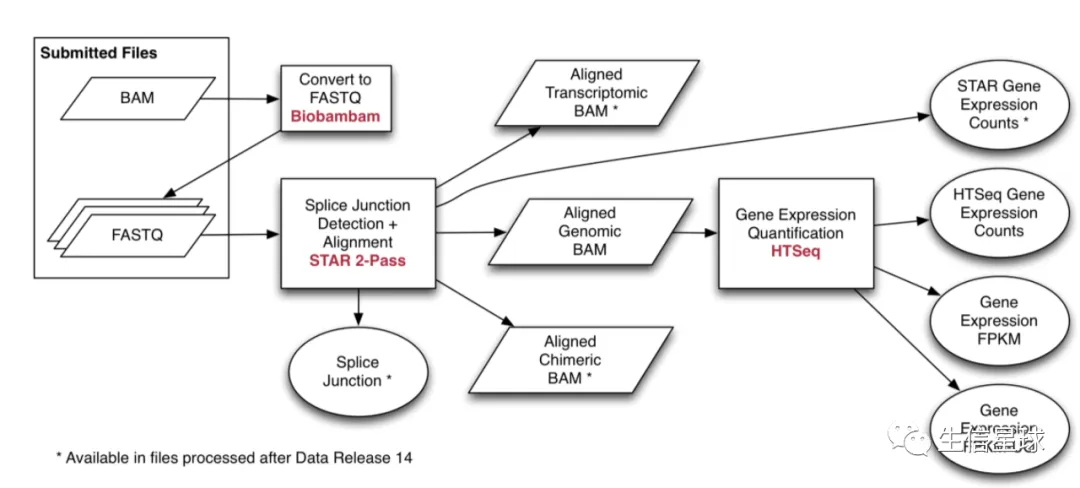
5.2 获取RNA-Seq数据
之前说过,GDC后来将TCGA数据重新分析了一遍,采用了统一的流程,对于RNA-Seq就是
(图片来自:https://docs.gdc.cancer.gov/Data/Bioinformatics_Pipelines/Expression_mRNA_Pipeline/)
然后有几种不同的RNA-Seq结果类型:
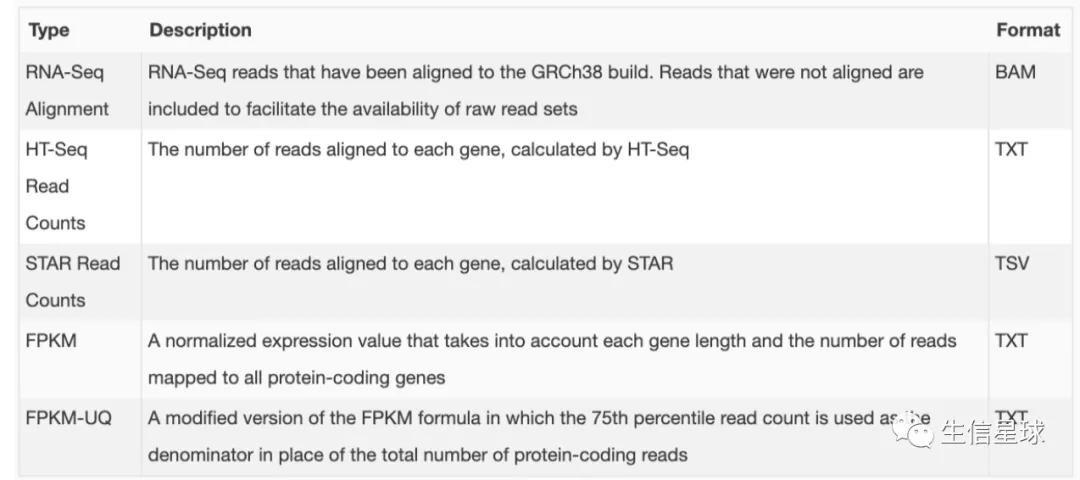
在GDCquery中,可以这么设置参数,尤其是workflow.type有多种选择:
- data.category: “Transcriptome Profiling”
- data.type: “Gene Expression Quantification”
- workflow.type: “HTSeq - Counts”, “HTSeq - FPKM”, “HTSeq - FPKM-UQ”
query.exp.hg38 <- GDCquery(project = "TCGA-GBM",
                  data.category = "Transcriptome Profiling",
                  data.type = "Gene Expression Quantification",
                  workflow.type = "HTSeq - Counts",
                  barcode =  c("TCGA-14-0736-02A-01R-2005-01", "TCGA-06-0211-02A-02R-2005-01"))
GDCdownload(query.exp.hg38)
raw.counts <- GDCprepare(query = query.exp.hg38, summarizedExperiment = FALSE)
5.3 获取突变数据
使用GDCquery_Maf:download MAF aligned against hg38
# Pipelines 可选参数: muse, varscan2, somaticsniper, mutect
maf <- GDCquery_Maf("COAD", pipelines = "muse")
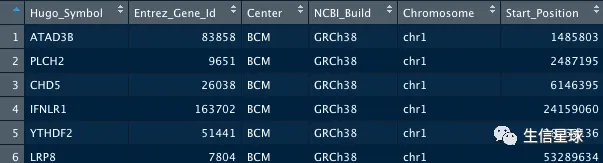
maf %>% head %>% as.data.frame
# 可视化
# using maftools for data summary
maftools.input <- maf %>% read.maf

# Check summary
plotmafSummary(maf = maftools.input,
               rmOutlier = TRUE,
               addStat = 'median',
               dashboard = TRUE)
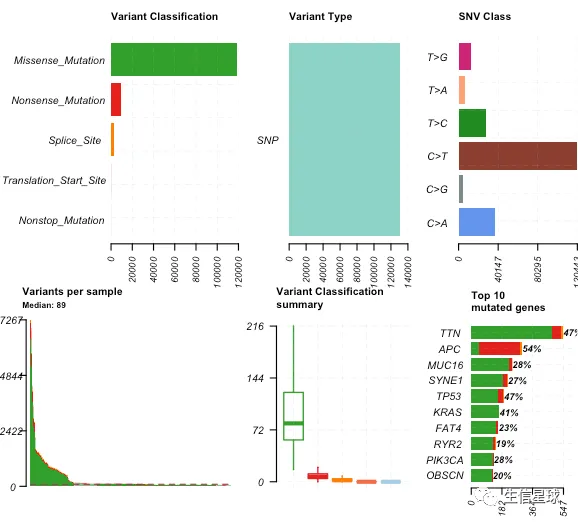
oncoplot(maf = maftools.input,
         top = 10,
         removeNonMutated = TRUE)

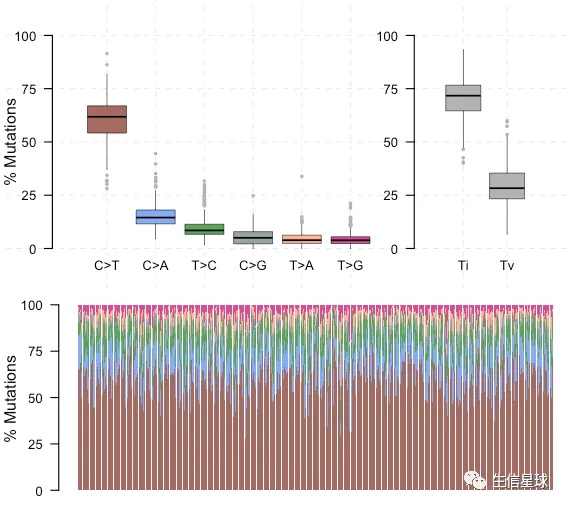
# classifies Single Nucleotide Variants into Transitions and Transversions
titv = titv(maf = maftools.input,
            plot = FALSE,
            useSyn = TRUE)
plotTiTv(res = titv)
#  extract sample summary
getSampleSummary(maftools.input)
5.4 拷贝数变异数据
pipeline在:https://docs.gdc.cancer.gov/Data/Bioinformatics_Pipelines/CNV_Pipeline/
Numeric focal-level Copy Number Variation (CNV) values were generated with “Masked Copy Number Segment” files from tumor aliquots using GISTIC2 on a project level.
只保留了蛋白编码基因,并且设置的CNV values noise cutoff 为0.3
- Genes with focal CNV values smaller than -0.3 are categorized as a “loss” (-1)
- Genes with focal CNV values larger than 0.3 are categorized as a “gain” (+1)
- Genes with focal CNV values between and including -0.3 and 0.3 are categorized as “neutral” (0)
query <- GDCquery(project = "TCGA-GBM",
data.category = "Copy Number Variation",
data.type = "Gene Level Copy Number Scores",
access = "open")
GDCdownload(query)
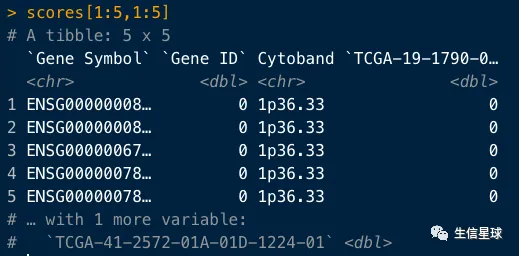
scores <- GDCprepare(query)
scores[1:5,1:5]
可以进行可视化
scores.matrix <- scores %>%
  dplyr::select(-c(1:3)) %>%  # Removes metadata from the first 3 columns
  as.matrix

rownames(scores.matrix) <- paste0(scores$`Gene Symbol`,"_",scores$Cytoband)

# gain in more than 100 samples
gain.more.than.hundred.samples <- which(rowSums(scores.matrix == 1) > 100)

# loss in more than 100 samples
loss.more.than.hundred.samples <- which(rowSums(scores.matrix == -1) > 100)

lines.selected <- c(gain.more.than.hundred.samples,loss.more.than.hundred.samples)

Heatmap(scores.matrix[lines.selected,],
        show_column_names = FALSE,
        show_row_names = TRUE,
         row_names_gp = gpar(fontsize = 8),
        col = circlize::colorRamp2(c(-1,0,1), colors = c("red","white","blue")))
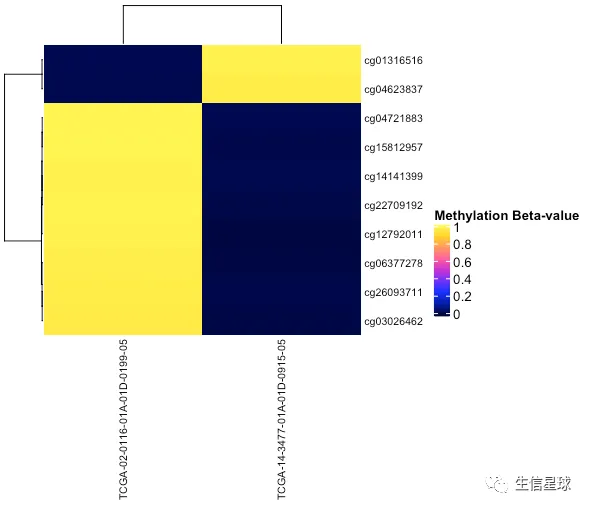
5.5 甲基化数据
pipeline在:https://docs.gdc.cancer.gov/Data/Bioinformatics_Pipelines/Methylation_LO_Pipeline/
数值在0-1之间,0 表示unmethylated , 1表示 fully methylated
query_met.hg38 <- GDCquery(project = "TCGA-GBM",
data.category = "DNA Methylation",
platform = "Illumina Human Methylation 27",
barcode = c("TCGA-02-0116-01A","TCGA-14-3477-01A-01D"))
GDCdownload(query_met.hg38)
data.hg38 <- GDCprepare(query_met.hg38,summarizedExperiment = TRUE)
data.hg38
## class: RangedSummarizedExperiment
## dim: 27578 2
## metadata(1): data_release
## assays(1): ''
## rownames(27578): cg00000292 cg00002426 ... cg27662877 cg27665659
## rowData names(7): Composite.Element.REF Gene_Symbol ...
## CGI_Coordinate Feature_Type
## colnames(2): TCGA-02-0116-01A-01D-0199-05
## TCGA-14-3477-01A-01D-0915-05
## colData names(113): sample patient ...
## subtype_Telomere.length.estimate.in.blood.normal..Kb.
## subtype_Telomere.length.estimate.in.tumor..Kb.
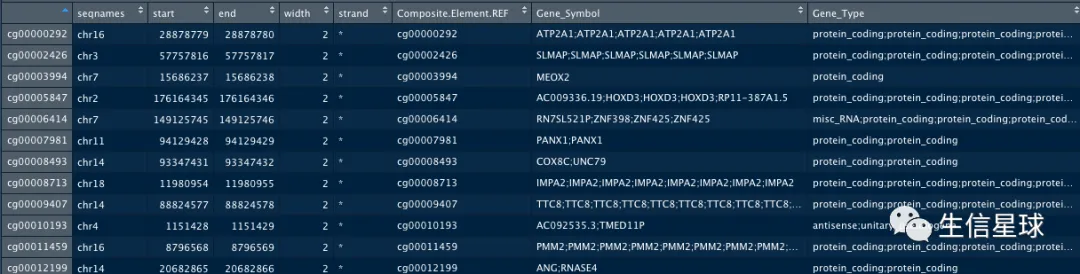
# 看看探针信息
library(SummarizedExperiment)
data.hg38 %>% rowRanges %>% as.data.frame
然后样本注释信息
data.hg38 %>% colData %>% as.data.frame

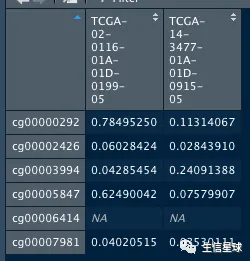
DNA甲基化探针信号值信息
data.hg38 %>% assay %>% head %>% as.data.frame
看看top10变化最大的探针
# plot 10 most variable probes
data.hg38 %>%
  assay %>%
  rowVars %>%
  order(decreasing = TRUE) %>%
  head(10) -> idx

pal_methylation <- colorRampPalette(c("#000436",
                                      "#021EA9",
                                      "#1632FB",
                                      "#6E34FC",
                                      "#C732D5",
                                      "#FD619D",
                                      "#FF9965",
                                      "#FFD32B",
                                      "#FFFC5A"))(100)

Heatmap(assay(data.hg38)[idx,],
        show_column_names = TRUE,
        show_row_names = TRUE,
         name = "Methylation Beta-value",
         row_names_gp = gpar(fontsize = 8),
         column_names_gp = gpar(fontsize = 8),
        col = circlize::colorRamp2(seq(0, 1, by = 1/99), pal_methylation))
6 还有更多内容
比如:ATAC-seq Workshop:http://rpubs.com/tiagochst/atac_seq_workshop
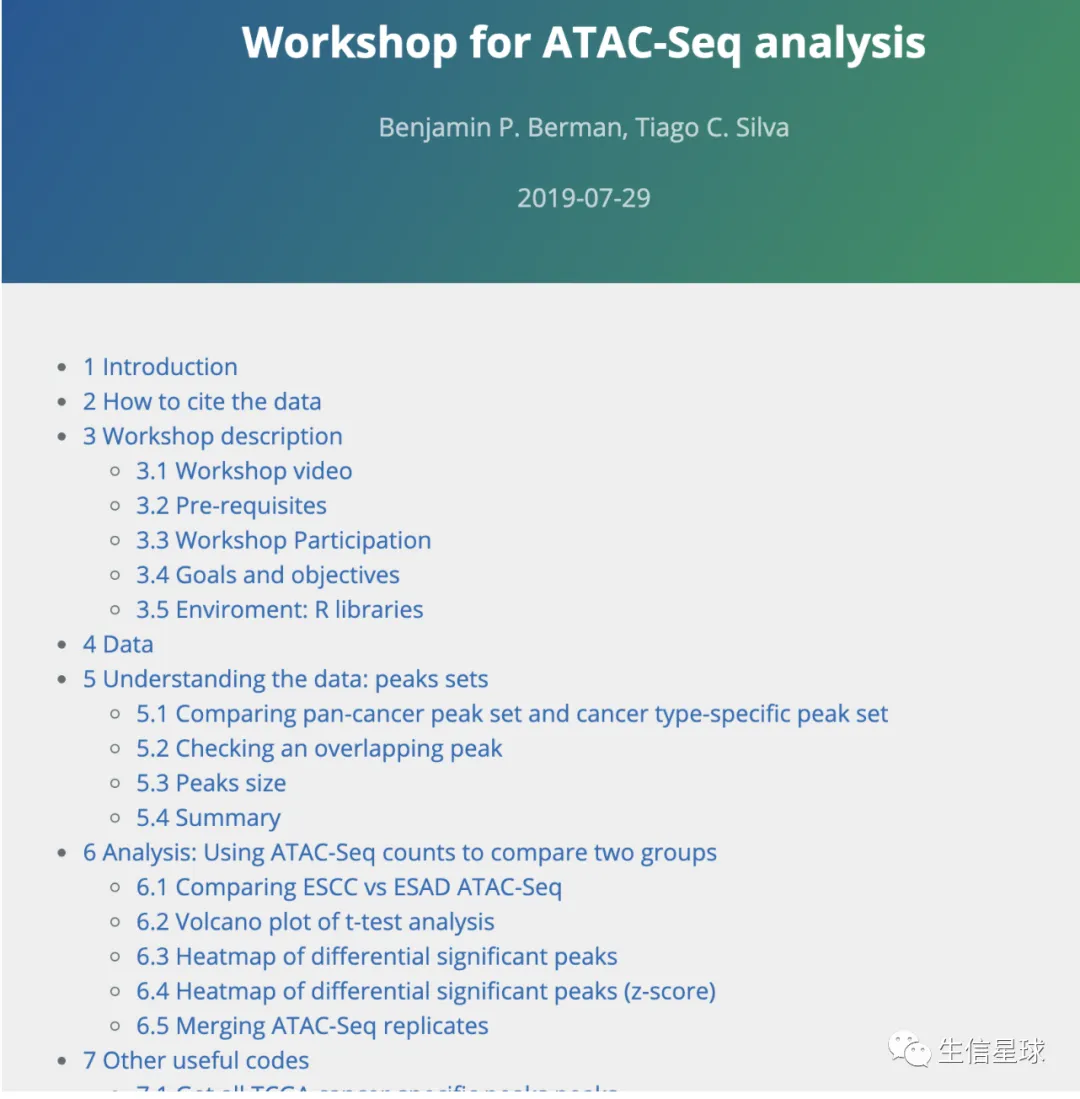
Workshop for multi-omics analysis with ELMER: https://rpubs.com/tiagochst/ELMER_workshop