051-对R的一些新认识
刘小泽写于18.11.2 豆豆偷偷回来一天
这几天都是花花在写教程,我在旁边看着,被论文拖住了,我今天忍不住又学了点东西。唉,这年头,不学点知识充实充实,都感觉对不住自己的十几个小时
今天突然有兴趣学起了dplyr,确实很给力,看花花一直使用十分眼馋啊🤒 另外还学习了Rmd新技能,十分提高效率。全文均由Rmd导出
激动人心的时刻
第一次用Rmarkdown编辑,这个确实很效率,借此机会利用生物数据学习一下强大的dplyr、tydir:
- 第一部分 dplyr
- 第二部分 tidyr
- 第三部分 Rmd
第一部分 dplyr
其中的四个数据messy、tidy、dose、name2go.csv公众号后台回复rmd获得哦。另外附送Rmd官方小抄
加载包
library(dplyr)
library(readr)
读取数据
ydat <- read_csv("tidy.csv")
#> Parsed with column specification:
#> cols(
#>   symbol = col_character(),
#>   systematic_name = col_character(),
#>   nutrient = col_character(),
#>   rate = col_double(),
#>   expression = col_double(),
#>   bp = col_character(),
#>   mf = col_character()
#> )
先简单看下ydat数据
head(ydat$symbol)
#> [1] "SFB2" NA     "QRI7" "CFT2" "SSO2" "PSP2"
mean(ydat$expression)
#> [1] 0.003367182
sd(ydat$expression)
#> [1] 0.6675023
range(ydat$rate)
#> [1] 0.05 0.30
看一下dplyr能干啥
#能看到包含的几个主要函数
ydat %>%
    filter(bp == "leucine biosynthesis") %>%
    group_by(nutrient,symbol) %>%
    summarize(mean=mean(expression),
              sd=sd(expression),
              r=cor(rate,expression))
#> # A tibble: 24 x 5
#> # Groups:   nutrient [?]
#>    nutrient symbol   mean    sd      r
#>    <chr>    <chr>   <dbl> <dbl>  <dbl>
#>  1 Ammonia  LEU1   -0.818 0.387  0.659
#>  2 Ammonia  LEU2   -0.535 0.379 -0.193
#>  3 Ammonia  LEU4   -0.368 0.561 -0.670
#>  4 Ammonia  LEU9   -1.01  0.641  0.870
#>  5 Glucose  LEU1   -0.553 0.412  0.979
#>  6 Glucose  LEU2   -0.393 0.327  0.899
#>  7 Glucose  LEU4    1.09  1.01  -0.972
#>  8 Glucose  LEU9   -0.165 0.346  0.354
#>  9 Leucine  LEU1    2.70  1.08  -0.951
#> 10 Leucine  LEU2    0.285 1.16  -0.974
#> # ... with 14 more rows
分步开始学习
1. filter()
1.1 找某个基因
filter(ydat, symbol == "LEU1") %>% head
#> # A tibble: 6 x 7
#>   symbol systematic_name nutrient  rate expression bp        mf
#>   <chr>  <chr>           <chr>    <dbl>      <dbl> <chr>     <chr>
#> 1 LEU1   YGL009C         Glucose   0.05      -1.12 leucine … 3-isopropylm…
#> 2 LEU1   YGL009C         Glucose   0.1       -0.77 leucine … 3-isopropylm…
#> 3 LEU1   YGL009C         Glucose   0.15      -0.67 leucine … 3-isopropylm…
#> 4 LEU1   YGL009C         Glucose   0.2       -0.59 leucine … 3-isopropylm…
#> 5 LEU1   YGL009C         Glucose   0.25      -0.2  leucine … 3-isopropylm…
#> 6 LEU1   YGL009C         Glucose   0.3        0.03 leucine … 3-isopropylm…
1.2 找多个基因
filter(ydat, symbol == "LEU1" | symbol == "ADH2") %>% head
#> # A tibble: 6 x 7
#>   symbol systematic_name nutrient  rate expression bp        mf
#>   <chr>  <chr>           <chr>    <dbl>      <dbl> <chr>     <chr>
#> 1 LEU1   YGL009C         Glucose   0.05      -1.12 leucine … 3-isopropylm…
#> 2 ADH2   YMR303C         Glucose   0.05       6.28 fermenta… alcohol dehy…
#> 3 LEU1   YGL009C         Glucose   0.1       -0.77 leucine … 3-isopropylm…
#> 4 ADH2   YMR303C         Glucose   0.1        5.81 fermenta… alcohol dehy…
#> 5 LEU1   YGL009C         Glucose   0.15      -0.67 leucine … 3-isopropylm…
#> 6 ADH2   YMR303C         Glucose   0.15       5.64 fermenta… alcohol dehy…
1.3 看下生长率最低时(0.05)LEU1基因表达量
# 注意LEU1和leucine的相关性
filter(ydat, symbol == "LEU1" & rate == .05)
#> # A tibble: 6 x 7
#>   symbol systematic_name nutrient   rate expression bp       mf
#>   <chr>  <chr>           <chr>     <dbl>      <dbl> <chr>    <chr>
#> 1 LEU1   YGL009C         Glucose    0.05      -1.12 leucine… 3-isopropylm…
#> 2 LEU1   YGL009C         Ammonia    0.05      -0.76 leucine… 3-isopropylm…
#> 3 LEU1   YGL009C         Phosphate  0.05      -0.81 leucine… 3-isopropylm…
#> 4 LEU1   YGL009C         Sulfate    0.05      -1.57 leucine… 3-isopropylm…
#> 5 LEU1   YGL009C         Leucine    0.05       3.84 leucine… 3-isopropylm…
#> 6 LEU1   YGL009C         Uracil     0.05      -2.07 leucine… 3-isopropylm…
1.4 只显示 LEU1和Leucine的数据
filter(ydat, ydat$symbol == "LEU1" & ydat$nutrient == "Leucine")
#> # A tibble: 6 x 7
#>   symbol systematic_name nutrient  rate expression bp        mf
#>   <chr>  <chr>           <chr>    <dbl>      <dbl> <chr>     <chr>
#> 1 LEU1   YGL009C         Leucine   0.05       3.84 leucine … 3-isopropylm…
#> 2 LEU1   YGL009C         Leucine   0.1        3.36 leucine … 3-isopropylm…
#> 3 LEU1   YGL009C         Leucine   0.15       3.24 leucine … 3-isopropylm…
#> 4 LEU1   YGL009C         Leucine   0.2        2.84 leucine … 3-isopropylm…
#> 5 LEU1   YGL009C         Leucine   0.25       2.04 leucine … 3-isopropylm…
#> 6 LEU1   YGL009C         Leucine   0.3        0.87 leucine … 3-isopropylm…
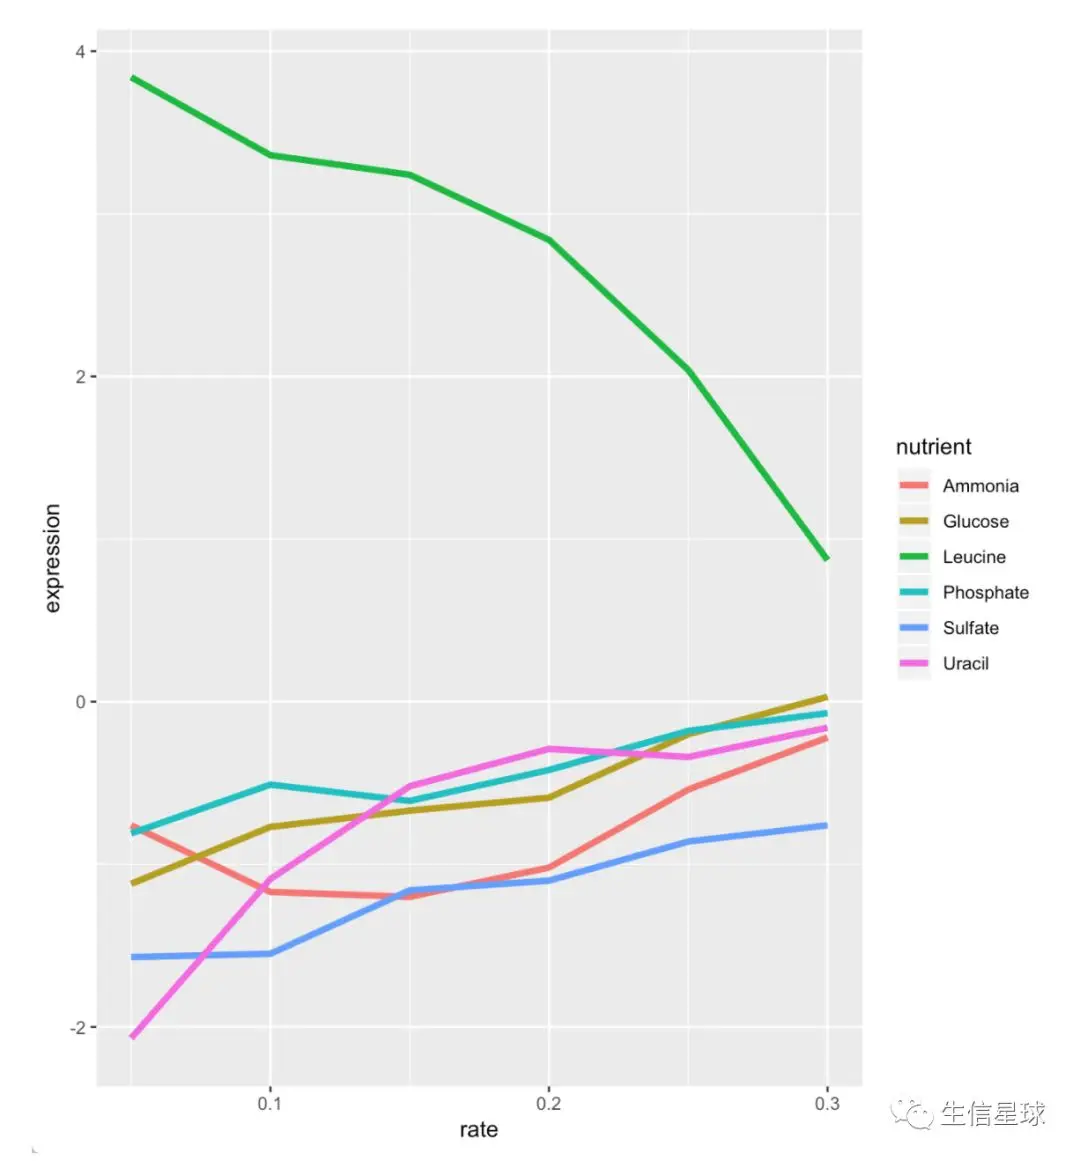
1.5 filter + ggplot2
# NOTE LEU1 is highly expressed when starved of leucine!
library(ggplot2)
#> Need help getting started? Try the cookbook for R:
#> http://www.cookbook-r.com/Graphs/
filter(ydat, ydat$symbol == "LEU1") %>%
    ggplot(aes(rate, expression, colour = nutrient))+
           geom_line(lwd=1.5)
1.6 小练习
# display bp variable is "leucine biosynthesis" and nutrient was Leucine, then decide genes number
filter(ydat, ydat$bp == "leucine biosynthesis" & ydat$nutrient == "Leucine") %>% select(symbol) %>% unique()

# show expression value which is >99%
filter(ydat,
       ydat$expression >quantile(ydat$expression, probs = .99))
2. select()
# just type colname is fine
select(ydat, symbol, systematic_name)

# remove columns
nogo <- select(ydat, -bp, -mf)
nogo
filter(nogo, symbol == "LEU1" & rate == .05)
3.mutate()
mutate(nogo, signal = 2^expression) %>% head
#> # A tibble: 6 x 6
#> symbol systematic_name nutrient rate expression signal
#> <chr> <chr> <chr> <dbl> <dbl> <dbl>
#> 1 SFB2 YNL049C Glucose 0.05 -0.24 0.847
#> 2 <NA> YNL095C Glucose 0.05 0.28 1.21
#> 3 QRI7 YDL104C Glucose 0.05 -0.02 0.986
#> 4 CFT2 YLR115W Glucose 0.05 -0.33 0.796
#> 5 SSO2 YMR183C Glucose 0.05 0.05 1.04
#> 6 PSP2 YML017W Glucose 0.05 -0.69 0.620
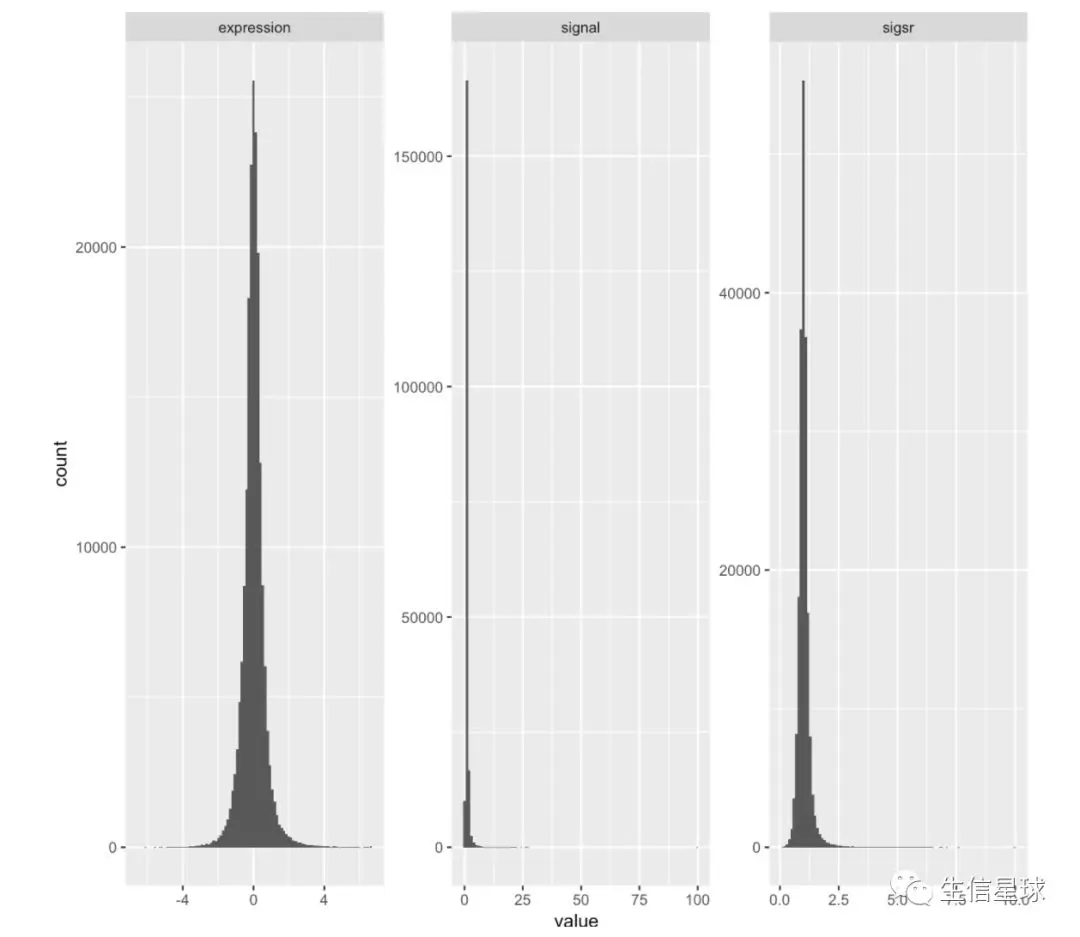
# mutate(nogo, signal = 2^expression, sigsr = sqrt(signal)) %>% head
# 看看tidydata长什么样
library(tidyr)
mutate(nogo, signal=2^expression, sigsr=sqrt(signal)) %>%
    gather(unit, value, expression:sigsr) %>%
    ggplot(aes(value))+geom_histogram(bins = 100)+facet_wrap(~unit, scales = "free")
4.arrange()
arrange(ydat, symbol)
arrange(ydat, expression)
arrange(ydat, desc(expression)) # arrange by decending
4.1 exercise
filter(ydat, bp == "leucine biosynthesis" & nutrient == "Leucine") %>% arrange(symbol)
#> # A tibble: 24 x 7
#>    symbol systematic_name nutrient  rate expression bp        mf
#>    <chr>  <chr>           <chr>    <dbl>      <dbl> <chr>     <chr>
#>  1 LEU1   YGL009C         Leucine   0.05       3.84 leucine … 3-isopropyl…
#>  2 LEU1   YGL009C         Leucine   0.1        3.36 leucine … 3-isopropyl…
#>  3 LEU1   YGL009C         Leucine   0.15       3.24 leucine … 3-isopropyl…
#>  4 LEU1   YGL009C         Leucine   0.2        2.84 leucine … 3-isopropyl…
#>  5 LEU1   YGL009C         Leucine   0.25       2.04 leucine … 3-isopropyl…
#>  6 LEU1   YGL009C         Leucine   0.3        0.87 leucine … 3-isopropyl…
#>  7 LEU2   YCL018W         Leucine   0.05       1.54 leucine … 3-isopropyl…
#>  8 LEU2   YCL018W         Leucine   0.1        1.23 leucine … 3-isopropyl…
#>  9 LEU2   YCL018W         Leucine   0.15       0.69 leucine … 3-isopropyl…
#> 10 LEU2   YCL018W         Leucine   0.2        0.39 leucine … 3-isopropyl…
#> # ... with 14 more rows
5.summarize()
# get mean value
summarize(ydat, meanexp=mean(expression))
#> # A tibble: 1 x 1
#>   meanexp
#>     <dbl>
#> 1 0.00337

# measure correlation
summarize(ydat, r=cor(rate, expression))
#> # A tibble: 1 x 1
#>         r
#>     <dbl>
#> 1 -0.0220

# total num of observation
summarize(ydat,total=n())
#> # A tibble: 1 x 1
#>    total
#>    <int>
#> 1 198430

# total distinct num
summarize(ydat, distinct=n_distinct(symbol))
#> # A tibble: 1 x 1
#>   distinct
#>      <int>
#> 1     4211
6.group_by()
ydat
group_by(ydat, nutrient)
group_by(ydat, nutrient, expression)
# real power comes with summarize
summarize(group_by(ydat, symbol), meanexp=mean(expression))
#> # A tibble: 4,211 x 2
#>    symbol  meanexp
#>    <chr>     <dbl>
#>  1 AAC1    0.529
#>  2 AAC3   -0.216
#>  3 AAD10   0.438
#>  4 AAD14  -0.0717
#>  5 AAD16   0.242
#>  6 AAD4   -0.792
#>  7 AAD6    0.290
#>  8 AAH1    0.0461
#>  9 AAP1   -0.00361
#> 10 AAP1'  -0.421
#> # ... with 4,201 more rows

summarize(group_by(ydat, nutrient), r=cor(rate, expression))
#> # A tibble: 6 x 2
#>   nutrient        r
#>   <chr>       <dbl>
#> 1 Ammonia   -0.0175
#> 2 Glucose   -0.0112
#> 3 Leucine   -0.0384
#> 4 Phosphate -0.0194
#> 5 Sulfate   -0.0166
#> 6 Uracil    -0.0353
6.1 exercise
filter(ydat, rate ==.05 & symbol == "ADH2") %>%
    select(nutrient, expression)
#> # A tibble: 6 x 2
#>   nutrient  expression
#>   <chr>          <dbl>
#> 1 Glucose         6.28
#> 2 Ammonia         0.55
#> 3 Phosphate      -4.6
#> 4 Sulfate        -1.18
#> 5 Leucine         4.15
#> 6 Uracil          0.63

filter(ydat, rate == .05 & nutrient == "Leucine") %>%
    arrange(desc(expression)) %>% head %>%
    select(symbol, expression, bp)
#> # A tibble: 6 x 3
#>   symbol expression bp
#>   <chr>       <dbl> <chr>
#> 1 HXT3         5.16 hexose transport
#> 2 HXT5         4.9  hexose transport
#> 3 HSP26        4.86 response to stress*
#> 4 QDR2         4.61 multidrug transport
#> 5 YRO2         4.4  biological process unknown
#> 6 BAP3         4.29 amino acid transport

filter(ydat, rate == .05 & bp == "response to stress") %>%
    group_by(nutrient)%>% summarize( meanexp=mean(expression) )
#> # A tibble: 6 x 2
#>   nutrient  meanexp
#>   <chr>       <dbl>
#> 1 Ammonia     0.943
#> 2 Glucose     0.743
#> 3 Leucine     0.811
#> 4 Phosphate   0.981
#> 5 Sulfate     0.743
#> 6 Uracil      0.731
第二部分 tidyr
加载包和数据
library(readr)
library(dplyr)
library(tidyr)
hr <- read_csv("dose.csv")
#> Parsed with column specification:
#> cols(
#>   name = col_character(),
#>   a_10 = col_integer(),
#>   a_20 = col_integer(),
#>   b_10 = col_integer(),
#>   b_20 = col_integer(),
#>   c_10 = col_integer(),
#>   c_20 = col_integer()
#> )
分步来认识一下
1. gather()
hr %>% gather(key = drugdose, value = hr, a_10:c_20) %>% head
#> # A tibble: 6 x 3
#>   name  drugdose    hr
#>   <chr> <chr>    <int>
#> 1 jon   a_10        60
#> 2 ann   a_10        65
#> 3 bill  a_10        70
#> 4 kate  a_10        75
#> 5 joe   a_10        80
#> 6 jon   a_20        55
hr %>% gather(key = drugdose, value = hr, -name) %>% head
#> # A tibble: 6 x 3
#>   name  drugdose    hr
#>   <chr> <chr>    <int>
#> 1 jon   a_10        60
#> 2 ann   a_10        65
#> 3 bill  a_10        70
#> 4 kate  a_10        75
#> 5 joe   a_10        80
#> 6 jon   a_20        55
2.seperate()
hr %>% gather(key = drugdose, value = hr, -name) %>%
    separate(drugdose, into=c("drug", "dose"), sep="_") %>% head
3.gather %>% separate %>% filter %>% group_by %>% summerize
3.1 create a new date.frame
hrtidy <- hr %>%
    gather(key = drugdose, value = hr,-name) %>%
    separate(drugdose, into=c("drug", "dose"), sep = "_")
# View(hrtidy)
3.2 filter
hrtidy %>% filter(drug == "a")
hrtidy %>% filter(dose == 20)
hrtidy %>% filter(hr>=80)
3.3 analyze
hrtidy %>%
    filter(name!="joe") %>%
    group_by(drug, dose) %>%
    summarize(meanhr=mean(hr))
那么如何将messy data变tidy呢?
先看看什么叫messy data
yorig <- read_csv("messy.csv")
#> Parsed with column specification:
#> cols(
#>   .default = col_double(),
#>   GID = col_character(),
#>   YORF = col_character(),
#>   NAME = col_character(),
#>   GWEIGHT = col_integer()
#> )
#> See spec(...) for full column specifications.
yorig[1:6,1:10] %>% knitr::kable()
| GID | YORF | NAME | GWEIGHT | G0.05 | G0.1 | G0.15 | G0.2 | G0.25 | G0.3 |
|---|---|---|---|---|---|---|---|---|---|
| GENE1331X | A_06_P5820 | SFB2::YNL049C::1082129 | 1 | -0.24 | -0.13 | -0.21 | -0.15 | -0.05 | -0.05 |
| GENE4924X | A_06_P5866 | NA::YNL095C::1086222 | 1 | 0.28 | 0.13 | -0.40 | -0.48 | -0.11 | 0.17 |
| GENE4690X | A_06_P1834 | QRI7::YDL104C::1085955 | 1 | -0.02 | -0.27 | -0.27 | -0.02 | 0.24 | 0.25 |
| GENE1177X | A_06_P4928 | CFT2::YLR115W::1081958 | 1 | -0.33 | -0.41 | -0.24 | -0.03 | -0.03 | 0.00 |
| GENE511X | A_06_P5620 | SSO2::YMR183C::1081214 | 1 | 0.05 | 0.02 | 0.40 | 0.34 | -0.13 | -0.14 |
| GENE2133X | A_06_P5307 | PSP2::YML017W::1083036 | 1 | -0.69 | -0.03 | 0.23 | 0.20 | 0.00 | -0.27 |
| step1: seperate the NAME and remove unwanted stuff |
yorig %>%
    separate(NAME, into = c("symbol", "systematic_name", "somenum"),
             sep = "::") %>%
    select(-GID, -YORF, -somenum, -GWEIGHT) %>% head
step2: gather the data then separate
ynogo <- yorig %>%
    separate(NAME, into = c("symbol", "systematic_name", "somenum"),
             sep = "::") %>%
    select(-GID, -YORF, -somenum, -GWEIGHT) %>%
    gather(key = nutrientrate, value = expression, G0.05:U0.3) %>%
    separate(nutrientrate, into = c("nutrient", "rate"),sep = 1)
step3: inner_join to GO
# import the data
sn2go <- read_csv("name2go.csv")
#> Parsed with column specification:
#> cols(
#>   systematic_name = col_character(),
#>   bp = col_character(),
#>   mf = col_character()
#> )
head(sn2go)
# inner join
yjoined <- inner_join(ynogo, sn2go, by="systematic_name")
yjoined
# left join (use NA to replace no corresponding entry)
yljoined <- left_join(ynogo, sn2go, by="systematic_name")
yljoined
# see a little bit
glimpse(yjoined)
glimpse(yljoined)
step4: change nutrient
nutrientlookup <-
    data_frame(nutrient = c("G", "L", "N", "P", "S", "U"), nutrientname = c("Glucose", "Leucine", "Ammonia","Phosphate", "Sulfate","Uracil"))

yjoined<- yjoined %>%
    mutate(rate = as.numeric(rate)) %>%
    mutate(symbol = ifelse(symbol == "NA", NA, symbol)) %>%
    left_join(nutrientlookup) %>%
    select(-nutrient) %>%
    select(symbol:systematic_name, nutrient = nutrientname, rate:mf)
#> Joining, by = "nutrient"
yjoined %>% head %>% knitr::kable()
最后的tidy data,可以和一开始的那个对比一下
| symbol | systematic_name | nutrient | rate | expression | bp | mf |
|---|---|---|---|---|---|---|
| SFB2 | YNL049C | Glucose | 0.05 | -0.24 | ER to Golgi transport | molecular function unknown |
| NA | YNL095C | Glucose | 0.05 | 0.28 | biological process unknown | molecular function unknown |
| QRI7 | YDL104C | Glucose | 0.05 | -0.02 | proteolysis and peptidolysis | metalloendopeptidase activity |
| CFT2 | YLR115W | Glucose | 0.05 | -0.33 | mRNA polyadenylylation* | RNA binding |
| SSO2 | YMR183C | Glucose | 0.05 | 0.05 | vesicle fusion* | t-SNARE activity |
| PSP2 | YML017W | Glucose | 0.05 | -0.69 | biological process unknown | molecular function unknown |
第三部分 Rmd的学习
还是非常偶然的,之前一直用typora编辑,效率也比较高,但存在一个问题,就是当笔记中代码比较多时,就需要不断从R和typpora切换,十分麻烦。今天本来只是想看看dplyr和tidyr,然后想到为什么不能把所学的代码直接用r里的代码块导出呢?于是看了下Rmd,很简单,三五分钟就可以学会,豆豆和花花都已经体验过了,你也可以的!
介绍一下Rmd
它的应用主要是方便人们重复代码、教程。一般来说,好的重复流程有10个亮点:
- 代码写在一个一个小块中 【code in small chunks】
- 有版本迭代 【make incrementla changes (version control)】
- 代码中要有实例数据【add tests in code】
- 不要重复造轮子,多搜索别人已经写好的函数【don’t reinvent wheel】
- 不要在原始数据上修改【make data read-only rather than modifying original data】
- 创建project,数据放在一个文件夹下【use project into one dir】
- 代码开源,毕竟是共享社会嘛,自己的代码需要流转【release code (GitHub, RPubs, Figshare)】
- 使用相对路径,不要用绝对路径【(e.g. data/huahua.csv NOT /Users/Download/Data/huahua.csv)】
- 有随机数需要设置seed【set.seed() 】
- 注释信息要详细【when and how to download data; data version;software version】
如何使用Rmd【四步走】
其实就是加强版的markdown
- 第一步:新建project=》file=》R Markdown =》 From template=》选HTML
- 第二步:进入Rmd的模版,熟悉md的小伙伴一定对其中的代码很熟悉了,包括标题大小、加粗、引用、代码块等
- 第三步:在模版基础上修改,另外记住两个快捷键
第一个:插入代码块 ctrl/cmd + alt/option + i 第二个:快速knit,修饰成html格式 ctrl/cmd + shift + k
- 第四步:导出为md
library(knitr)
knit("Rmd-homework.Rmd")