157-如何给自己的热图加注释信息?
刘小泽写于2020.1.8 今天的内容很简单,来看看两个热图
前言
这次要实现的目标是:利用pheatmap和ComplexHeatmap来为热图加上样本的注释信息
例如:
首先构造一个测试数据
参考之前花花非常用心写的: 看帮助文档学热图
# 表达矩阵(20基因 x 10样本)
test = matrix(rnorm(200), 20, 10)
test[1:10, seq(1, 9, 2)] = test[1:10, seq(1, 9, 2)] + 3
test[11:20, seq(2, 10, 2)] = test[11:20, seq(2, 10, 2)] + 2
test[15:20, seq(2, 10, 2)] = test[15:20, seq(2, 10, 2)] + 4
colnames(test) = paste("Test", 1:10, sep = "")
rownames(test) = paste("Gene", 1:20, sep = "")
# 样本注释信息
sample_info = data.frame(
  CellType = factor(rep(c("CT1", "CT2"), 5)),
  Time = 1:5
)

> head(sample_info)
  CellType Time
1      CT1    1
2      CT2    2
3      CT1    3
4      CT2    4
5      CT1    5
6      CT2    1
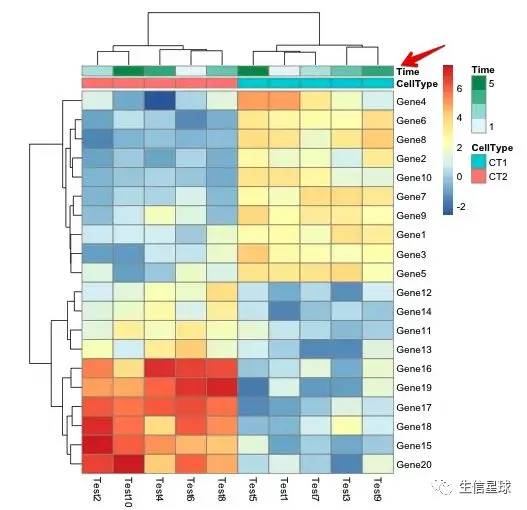
用Pheatmap画图
这个其实看花花写的那个就很清楚了,这里只是简单介绍
需要在绘图函数中添加一个annotation_col参数,这个参数的内容就是上面的sample_info信息。
重点就是:将annotation_col的行名与表达矩阵的列名做到对应
library(pheatmap)
annotation_col = sample_info
rownames(annotation_col) = colnames(test)

pheatmap(test, annotation_col = annotation_col)
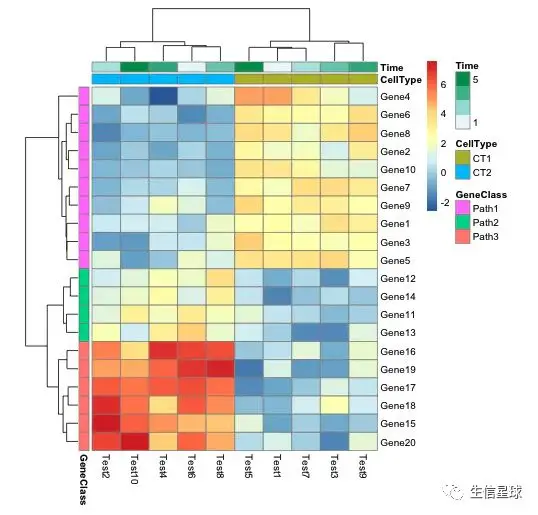
除了对表达矩阵的列(样本)进行注释,还可以对行(基因)进行注释
annotation_row = data.frame(
  GeneClass = factor(rep(c("Path1", "Path2", "Path3"), c(10, 4, 6)))
)
rownames(annotation_row) = rownames(test)

pheatmap(test, annotation_col = annotation_col, annotation_row = annotation_row)
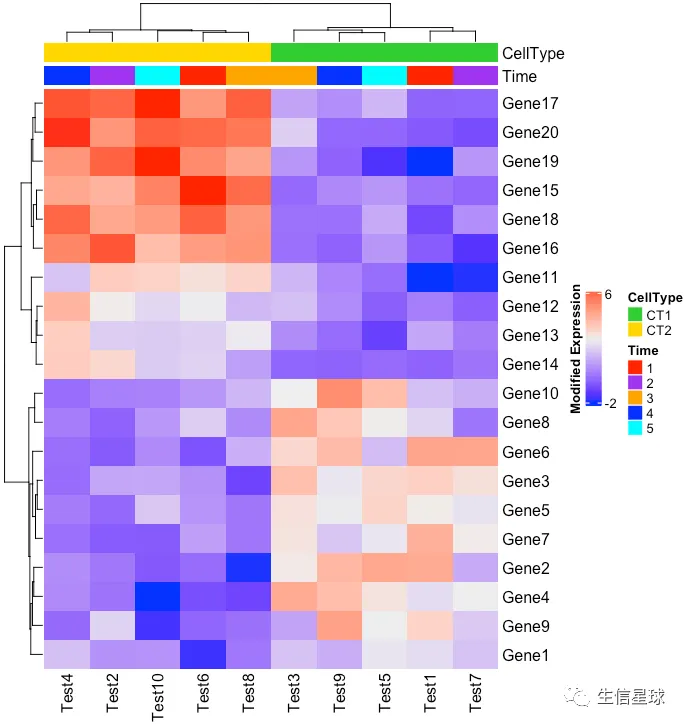
用ComplexHeatmap画图
之前介绍过ComplexHeatmap: 自己动手,丰衣足食~改造inferCNV的热图,但好像最后没有介绍如何加上样本的一些注释信息。参数很丰富,可以调整的东西也很多,这里看看怎么给热图加上注释信息
重点在于:指定HeatmapAnnotation
R包的说明文档中详细说明了如何去设计这个东西:https://jokergoo.github.io/ComplexHeatmap-reference/book/heatmap-annotations.html
# 10个样本分成了2种细胞类型和5个时间点
> table(sample_info$CellType)

CT1 CT2
  5   5
> table(sample_info$Time)

1 2 3 4 5
2 2 2 2 2
首先给不同的样本类型赋予不同颜色
colours <- list(
  "CellType"=c("CT1"="limegreen","CT2"="gold"),
  "Time"=c("1"="red","2"="purple","3"="orange",
                         "4"="blue","5"="#00FFFFFF"))
然后构建HeatmapAnnotation
相当于
pheatmap的annotation_col
colAnn <- HeatmapAnnotation(df=sample_info,
                            which="col", # 表示 column annotations
                            col=colours,
                            annotation_width=unit(c(1, 4), "cm"),
                            gap=unit(1, "mm"))
最后就是绘图
Heatmap(test,
        cluster_rows = T,
        cluster_columns = T,
        show_column_names = T,
        show_row_names = T,
        heatmap_legend_param = list(
          title = "Modified Expression",
          title_position = "leftcenter-rot", # 图例标题位置
          at=c(-2,6), #图例范围
          legend_height = unit(3, "cm") #图例长度
        ),
        top_annotation=colAnn)
小结
做图的函数有很多,应该都可以实现这个对行或者列的注释,只是使用不同的参数。
而重点在于,如何对样本进行标记并且转成函数认识的样子